The History of Power BI and Fabric
How Power BI and Fabric evolved from Excel, through SQL Server, Power Query and Power Pivot plugins, Power BI Services in the cloud, and on to Azure and Fabric offerings. Useful complementary information to understand today's Power BI offerings.

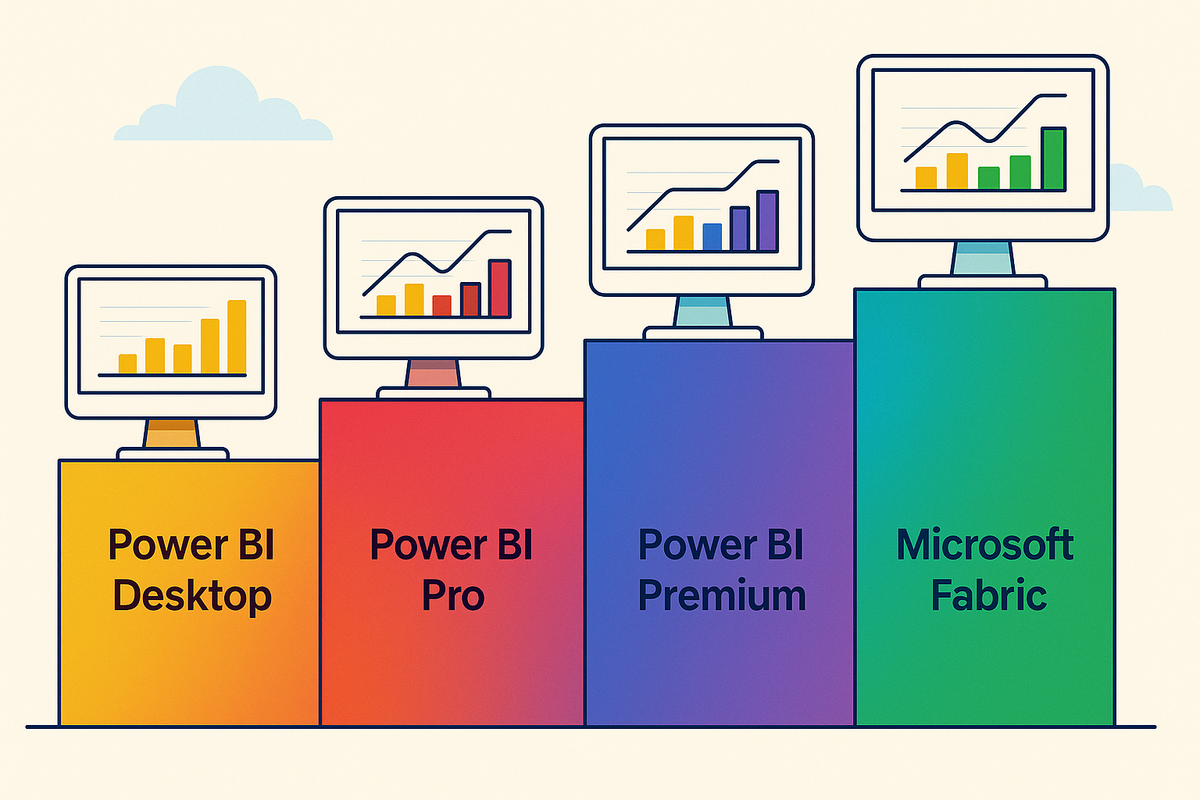
A while back, I wrote an article to help FinOps practitioners who build home-grown FinOps tooling with an understanding of the various options for using Power BI (like Desktop, Service, Pro, Premium, Capacities, Fabric, etc.). That article explains the differences in features, constraints, licensing, and pricing models of each.

While writing that article, I realized that I had a lot to say about the history of Power BI and Fabric, too, simply because I have been exposed to the various evolutionarily connected products at different stages of my career. I had many 'aha moments' along the way when I connected the dots across products, and I extended this with a bit of research and reading to dump it here in a consolidated form.
Power BI's ancestry is quite populous. In one way or another, it is related to so many other products that it is surprising to list them:
- Excel
- SQL Server
- Power Query and Power Pivot
- Power BI (Desktop), as a standalone application
- Power BI Service, as a platform in the cloud
- Various Azure products, such as Synapse, Data Factory, or Analysis Services
- Microsoft Intelligent Data Platform (also Azure Intelligence Platform)
- Microsoft Fabric (also Power BI Capacities)
Let's see how this amazing product story unfolded!
Power Started with Excel and SQL Server
Tracing back the roots of Power BI takes us to 1985. You read that right, 40 years back. That's when one of the two key products of its early ancestry, Excel 1.0 was born. Fun fact: Excel was released first for the Mac, only two years later for Windows.1
The next stop is 1989, the year when the Berlin Wall fell. This year, the other key ancestor, SQL Server 1.0, codename Filipi, was released, a relational database management system (RDBMS).2 Since then, both Excel and SQL Server have been Microsoft's flagship products of their category, and they passed on several standout traits to Power BI, which made it an ultimate BI tool. Other strong components of the SQL Server line have made it to the Azure Cloud and Fabric Capacity offerings.
When we talk about products like Excel and SQL Server, however, it is important to decompose the pack. These products comprise multiple smaller, but significant components that will help us draw the inheritance lines to Power BI, Azure, and Fabric.
About a decade after SQL Server appeared, around 2000, the database product was complemented with three business intelligence (BI) components.3 These were cutting-edge at the time and started to put Microsoft in a leading position in BI:
- SSIS - SQL Server Integration Services (earlier called Data Transformation Services or DTS) for the extraction, transformation and loading of data (ETL).
- SSRS - SQL Server Reporting Services for the creation of reports with tables and charts, at the time often still printed on paper and therefore paginated (document style).
- SSAS - SQL Server Analysis Services for analytical work (Online Analytical Processing - OLAP), that enabled multi-dimensional slicing and dicing of the data with lightning-fast response times driven by an in-memory data model. This latter component has evolved from an earlier acquisition of Microsoft from a Canadian BI company called Panorama Software.
Power Taking Shape in Its Own Body
Another decade later, around 2010, the first directly linkable traces of Power BI were called to life by members of the SSRS team. The idea was to make SQL Server's powerful analytical features available in Excel. They executed this under Project Gemini (don't mix it up with Google's AI product). The outcome was that Power Query and Power Pivot appeared in Excel 2010 and were offered as optional add-ins.4
Around this time, the idea of Power BI as a separate standalone application was already on the rise under the codename Project Crescent. The first download was available as soon as 2011, bundled with SQL Server 2012 Denali. Then, it was renamed to Power BI, and it was offered as part of Office 365. At this time, it was really based on the Excel add-ins Power Query, Power Pivot, and Power View. In the following years, it was enhanced with enterprise-focused features for connectivity and security, and it was eventually released on its own right to the public in 2015.
The same year, another Canadian company, Datazen, was acquired to complement Power BI, which was by then referred to as a "cloud-based business analytics service". As an essential addition, Datazen brought mobile capabilities to Power BI. In fact, most of the standard visuals you see today in Power BI have started as Datazen visuals. At this point, one could conclude too, that Power BI is in large part Canadian. By this time, it had developed into a more complete Business Intelligence solution and started to set foot as a service in the cloud.5
Power Coming to the Cloud
In the metamorphosis, the original Power BI standalone application and the SQL Server enterprise analytical product evolved into a cloud service in an intelligent manner. The brilliant thing about Power BI Desktop's architecture is that the underlying components that run locally on your computer can also run on a server or in the cloud. Remember, several of these parts originally came from the server world.
As an example, when you run the desktop application, it runs a local Analysis Services (SSAS) instance for you in the background. This behaves almost identically to a much larger server version. And indeed, behind the scenes, essentially, the same service is running in the cloud under the Azure or Power BI Service brand. Furthermore, your reports are rendered as HTML documents in the desktop application window, and the same thing can be served from a server to the browser.
This makes it straightforward to deploy the Power BI content you author in the desktop application into a cloud service, which allows others to connect to your data and consume your reports. This is what Power BI Service really is. It offers you a cloud platform composed of an upscaled version of your analysis and report rendering services, to make your content shareable, reusable, and distributable, and open the way for broad collaboration.
There is More to the Cloud, But Even More is Needed
Parallel to Power BI, Microsoft has successfully transformed much of the original SQL Server offering into other Azure cloud products. This encompasses Azure SQL (cloudified version of SQL Server), Azure Data Factory (cloudified version of SSIS) and extended the range with cloud-native analytical storage called Azure Data Lake Storage (Gen2) and massive parallel querying and processing capabilities with Azure Synapse Analytics. With Synapse, you can apply T-SQL queries on large-scale blob (file) storage in distributed containers (folders) to query several csv, parquet, or json files at once, and you can also run data transformation pipelines or batch and streaming analytics.
When you use Power BI for FinOps as your primary home-grown cost visibility tool, with automated data refreshes and browser-based shared reports, you most certainly use some of the mentioned Azure products or their equivalents from other providers (e.g., S3, Athena, Redshift, or BigQuery). From this perspective, the Power BI offering is not a complete package to serve all your needs.
It is also not a complete package to serve other data needs, like AI and ML-focused data science experimentation, utilizing Jupyter-like notebooks, Spark processing, or event-based real-time analytics. For all of these, there are disparate Azure products to serve you. But when you are served in silos, data gets duplicated, reuse is hindered, and different assumptions and treatments of data lead to the loss of a 'single source of truth'. Different numbers for the same things quickly lead to questions about correctness, instilling less productive discussions, and trust in the data is easily lost.
Weave Them Into One Fabric to Rule Them All
Microsoft felt the pain but also recognized the opportunity in the siloed offerings. Around 2020, they already had an Azure Intelligence Platform (AIP). This got renamed multiple times in two years, the latest being Microsoft Intelligent Data Platform or MIDP. It suffered an 'identity crisis' regarding where it should evolve with its flagship component. Synapse. Microsoft made a bold decision to merge its Synapse, data integration, and messaging portfolios with the by-then industry-dominant Power BI team. With this move, Project Trident was born and evolved into what we know today as Microsoft Fabric.6
Fabric was launched in 2023 as the unified, all-in-one, end-to-end cloud analytics platform. If you miss something from it, you are doing something really weird or bleeding-edge. Power BI is part of Fabric, and it is accompanied by familiar faces from the Azure world as well as new concepts to store and treat data: Lakehouse, Warehouse, Database, Data Pipelines, Spark, ML, AI, KQL, Streaming Data, Events, and more. It serves Data Engineering, Data Science, Data Warehousing, Real-time Intelligence, Business Intelligence, and other use cases, personas, and capabilities.
This is where we are today, and it wraps up the brief product history that led us up to Power BI and took us beyond to Fabric. For both products, understanding the offering, identifying what you really need, and assessing the required capacity, licenses, and costs is no small feat. This is what I will help you with in the other connected article 👇
References
-
Microsoft Excel , Wikipedia, Wiki-authors, 2024. [@2024‑12‑15] ↩
-
History of Microsoft SQL Server , Wikipedia, Wiki-authors, 2024. [@2024‑12‑15] ↩
-
History of Microsoft SQL Server , Wikipedia, Wiki-authors, 2024. [@2024‑12‑15] ↩
-
Power Pivot , Wikipedia, Wiki-authors, 2024. [@2024‑12‑15] ↩
-
Microsoft Power BI , Wikipedia, Wiki-authors, 2024. [@2024‑12‑15] ↩
-
Unravelling Microsoft Fabric , Hitachi Solutions, Simon Nuss, 2023. [@2024‑12‑15] ↩